> ## Documentation Index
> Fetch the complete documentation index at: https://help.lobyco.com/llms.txt
> Use this file to discover all available pages before exploring further.
# Bonus
> Surfacing bonus in your own mobile or web front end.
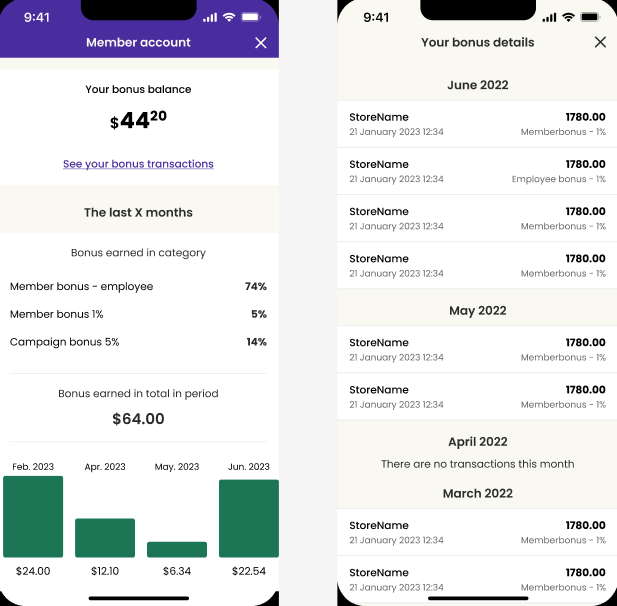
The Bonus product includes three key mobile components:
* Balance overview
* Bonus account statement history
* User statistics with visualized bonus accumulation over time (ideal for graphs)
Here is a reference of Lobyco White label implementation.
 ## Get Account Details
Retrieve account details using [GET /v1/members/memberId/accounts](/api-reference/bonus/bonus-accounting/get-v1-members-memberid-accounts). This returns the available bonus balance, which can be extended with reserved amounts or bonus points expiring within a specified period. The available balance can be used as a payment method during the user's next store visit.
Display the available bonus balance prominently on your app's main screen, as this is typically considered a core app feature.
## Get Account Statements
Statements show users which purchases accumulated bonus points, when, and where. Display these as a separate receipt list using [GET /v1/members/memberId/statements](/api-reference/bonus/bonus-accounting/get-v1-members-memberid-statements). This endpoint also indicates whether bonus points were:
* Granted as a base percentage on regular purchases
* Part of bonus campaigns (e.g., "Weekend deal")
* Rewards from games or challenges
## Get Account Statistics
Retrieve statistics using [GET /v1/members/memberId/statistics](/api-reference/bonus/bonus-accounting/get-v1-members-memberid-statistics) to show bonus accumulation by month, type, or total amount. Present this data as text summaries or use it to generate visual graphs.
## Get Account Details
Retrieve account details using [GET /v1/members/memberId/accounts](/api-reference/bonus/bonus-accounting/get-v1-members-memberid-accounts). This returns the available bonus balance, which can be extended with reserved amounts or bonus points expiring within a specified period. The available balance can be used as a payment method during the user's next store visit.
Display the available bonus balance prominently on your app's main screen, as this is typically considered a core app feature.
## Get Account Statements
Statements show users which purchases accumulated bonus points, when, and where. Display these as a separate receipt list using [GET /v1/members/memberId/statements](/api-reference/bonus/bonus-accounting/get-v1-members-memberid-statements). This endpoint also indicates whether bonus points were:
* Granted as a base percentage on regular purchases
* Part of bonus campaigns (e.g., "Weekend deal")
* Rewards from games or challenges
## Get Account Statistics
Retrieve statistics using [GET /v1/members/memberId/statistics](/api-reference/bonus/bonus-accounting/get-v1-members-memberid-statistics) to show bonus accumulation by month, type, or total amount. Present this data as text summaries or use it to generate visual graphs.